If you would like to learn more about networks and network analysis, please buy a copy of my book!
Graph Types (Batch 1)
In Day 6 of 100 days of 100daysofnetworks, we converted our Network Analysis graph into an actual study guide we could use to learn more about networks and graphs!
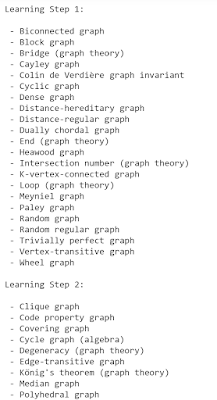
Today, I chose five types of graphs to explore from the study guide. You can see the study guide here. More specifically, today we are going to look at these five types of graphs:
- Cycle Graph
- Dense Graph
- Sparse Graph
- Regular Graph
- Wheel Graph
I recommend that you follow along with the code, today, as it explains how I did this and what I see. This blog post will be kept high level. Follow the code!
We're not just going to LOOK at these kinds of graphs. I will describe their characteristics, and if you look at the Jupyter notebook, you can see how they differ from each other in terms of centralities and shortest paths.
Network Analysis is exciting, and it's good to learn about different types of graphs, so that we have a name for them when we see them in the wild. Let's begin.
I will use summaries from ChatGPT. As I mention in the notebook, if you use an LLM, you should validate the output. Let me know if you see any errors in the summaries. They look good to me.
Finally, we have not discussed density much in regards to graphs. Density has to do with the interconnectedness of a network/graph. If every node is connected to every other node, the network will have a density value of 1.0. If zero nodes are connected with any other nodes, the network will have a density value of 0.0. Density tells a lot about how connected the network is.
Cycle Graph
ChatGPT: "A cycle graph is a type of graph in network science that forms a simple cycle, which is a closed path where each node is connected to exactly two neighbors except for the first and last nodes, which are connected to each other. Cycle graphs are fundamental structures in graph theory and are often used to model cyclic processes, circuits, and other scenarios with repeating patterns.
In other words, in a cycle graph, nodes are connected to a single node to form a cycle.
For example: A -> B -> C -> D -> A
Here is the graph I built.

Notice a few things:
- Nodes are connected to other nodes, forming a path in a single direction. A cycle would not exist if any of the arrows pointed the opposite direction. The flow would end on the first iteration.
- It's a long way from nodes on one side of the network to nodes on the other side of the network.
- It's not a dense network. Nodes are only linked to a single other node.
The structure of the graph also affects its centrality scores, as well. Every single node in this network has a betweenness centrality value of 0.5. No node stands out as being more important than any other node.
Shortest paths will be affected by the structure of this graph, as well:
- To get from node A to node C, the shortest path is A -> B -> C
- To get from node E to node C, the shortest path is E -> F -> G -> A -> B -> C
Shortest paths between nodes are not equal. This is not ideal for information flow.
If you wanted to make this more optimal for the flow of information between nodes, what do you think would help?
Dense Graph
ChatGPT: "A dense graph is a type of graph in network science where most of the possible edges are present, resulting in a high density of connections between nodes. In a dense graph, the number of edges is close to the maximum possible for the given number of nodes. Dense graphs are often used to model scenarios where interactions or relationships between entities are widespread and frequent."
In other words, in a dense graph, most nodes are connected with most other nodes. Here is the graph I built:

Notice a few things:
- In this example, every node is connected to every other node. This will result in this graph having a density value of 1.0.
- We could have dropped an edge and the graph would still have a high density value. It is a dense graph, even with one less edge, and would still fit the definition.
- Even though I am showing arrows, they are bi-directional. This is not actually a directed graph. I am leaving arrow in for all of today's visualizations, to reduce code. It still makes sense and is correct. An undirected graph has bi-directional flow.
- Even the visualization FEELS dense. There's a lot more going on in this graph than in the cycle graph.
The structure will also affect centrality scores. Check the notebook/code. Every node has a betweenness centrality of 0.0 and a degree centrality of 1.0. Essentially, all nodes are equally important, structurally.
However, compared to the cycle graph, this graph is optimal for information flow. The shortest path between each node will always be equal, because every node is connected to all other nodes. The shortest path from A to C is simply A->C, and the shortest path from E to C is simply E->C.
Sparse Graph
If the above is a dense graph, what do you think a sparse graph is? That's right. It is a graph where most nodes are not connected with all other nodes. It's the opposite of a dense graph. Here is an example:

Notice a few things:
- Most nodes are not connected with all other nodes in the graph. In fact, zero nodes are connected with all other nodes in the graph.
- There is SOME connectivity in this graph. There is some stuff happening. That is called a connected component.
- There are lots of isolate nodes. Those are the dots. Dots are called isolates. They are nodes that have no edges with any other nodes. They can be very important, or not important at all, depending on the network you are dealing with.
This is a sparsely connected graph, or a sparse graph. It will have a very low density score. This graph has a density value of 0.027. The dense graph had a density value of 1.0. In the wild, you will mainly run into sparse networks, and that is not a problem. That is the nature of reality. Networks follow Power Law, or the idea that Rich Get Richer. A few nodes will have many edges, and most nodes will have few edges. A few humans will be billionaires, and most people will not. Etc.
Betweenness centrality can be very useful in a sparse network, as can Page Rank and other centralities. If you look at the notebook, notice the following:
- Betweenness centrality found that one node was most important: node B. This is because it is the only node that sits between other nodes, or on the shortest path between other nodes.
- Degree centrality found that four nodes were important (A, B, C, D), but that one node (B) was most important.
Shortest paths between nodes are also impacted by the structure of this graph. Scroll up and think about this: how would node E talk to node K?
The answer is that it cannot. No information flow can take place between nodes E and K, or E and any other node, because node E is an isolate. It has no edges.
How would node A communicate with node D? It would go A->B->D.
The structure of a network has real world impact in how freely information will move in that ecosystem. Ideas are shared in a dense ecosystem. Information is essentially firewalled in isolates. Nothing is shared from or shared to isolates.
Regular Graph
ChatGPT: "A regular graph is a type of graph in network science where each node has the same number of connections or edges. In other words, all nodes in a regular graph have the same degree. Regular graphs are often studied for their uniform connectivity patterns and symmetry."
In other words, a regular graph is a graph where all nodes have the same number of edges. Here is my example:

Our dense graph is also a regular graph, as all nodes have the same number of edges.
So, there will be a few things to keep in mind:
- Density will be 1.0, as all nodes are connected to all other nodes.
- Shortest path between all nodes will be the same. There is a path from any node to any other node.
- Betweenness and degree centrality will have equal scores for all nodes, because none of them are different from each other, structurally.
This is simple enough. Let's keep moving.
Wheel Graph
I had never heard of or played with a Wheel Graph before today, so this was fun for me.
A wheel graph is identical to a cycle graph, but each of the outer nodes links to an inner node, creating what looks like a wheel. Here is my example:

Look closely and notice a few things:
- Although this looks like a cycle graph, it is very different. All edges are bidirectional, not one-way, and there is one node in the center that connects to every other node.
- This is an information flow optimization over a cycle graph, as all nodes are equal distance from each other. The optimization has to do with the central node being added and with the fact that all edges are bidirectional.
In terms of centralities:
- Betweenness centrality gives all nodes a value greater than 0, because all nodes sit between other nodes. However, one single node has a betweenness centrality that is 25x higher than every other node. Can you guess which one?
- Degree centrality gives all nodes a value greater than 0, because all nodes have edges with other nodes. Degree centrality has to do with the number of degrees (edges) that a node has, and all nodes in this graph have edges. However, one node has more edges, and has been given a value about 2x higher than every other node. Can you guess which node?
- So, both centrality scores were equally able to identify the most "central" node, but in my subjective opinion, betweenness centrality captures the relative importance better. Because if that node were dropped, information flow would be disrupted and shortest paths would be similar to the cycle graph where the distance from certain nodes would be far.
In terms of shortest paths, check out this image:

The shortest path between any node in this network is never more than three steps, because node H exists as a shortcut. To get from node A to node E, we can jump through H to get to our destination. Without H, we should have to go A->B->C->D->E.
Graph Structure Matters
I think of this as the structure of a graph, or the structure of a network. Different networks behave differently, and I hope I showed that today.
There are real-world implications to this:
- If you manage a network of things, you can bolster that network by adding more nodes and edges. This is defense.
- If you want to disrupt a sparse network, you can often shatter it (think Star Wars Death Star) by disrupting central nodes, nodes with high centrality values. This is offense. Removing a central node has a massive impact in sparse networks, and can completely isolate parts of the network. Think about what that means beyond graphs, to people and things.
Thank you!
Thank you for following along! This was fun! We've only done five of the graph types identified on day 6, and it was quite educational already!
If you would like to learn more about networks and network analysis, please buy a copy of my book!