Saturday, July 29, 2023

Day 5 of #100daysofnetworks - Wikipedia Knowledge Discovery!

 Welcome to day 5 of 100 Days of Networks!

Wikipedia Edgelist Generator

If you would like to learn more about networks and network analysis, please buy a copy of my book!

Today, I have a special treat for you! I created a Wikipedia Edgelist Generator that you can use for knowledge discovery on any topic that interests you. You can find the crawler / edgelist generator here!

I wanted to build a tool for knowledge discovery, and something that could be used no matter the topic to create complex networks that are more interesting than the small networks that come with NetworkX, and more interesting than using somebody else's dataset. To me, there is nothing more interesting than my own research, and I don't like using other people's datasets for learning. I prefer to analyze my own constructed networks, and do two things at the same time:

  1. Improve my network analysis skills
  2. Learn something about a topic of interest at the same time.

Today, I created the edgelist generator, and you may use it. I have added some guidance regarding iterations and sleeps at the top of the notebook. Please be responsible or Wikipedia will block your IP and you will get nothing.

Knowledge Discovery

The point of the edgelist generator is knowledge discovery, on any topic. For instance, to build today's dataset, I searched for four things:

  • Network Science
  • Social Network Analysis
  • Graph Theory
  • Causal Inference

If you look at the code on github, you will be able to see where and how I did that. After four iterations/loops of the crawling and edgelist generation, those four searches built a network of OVER 9000!!! nodes. That is why I call this knowledge discovery. Each of those 9000+ nodes is a Wikipedia page on a related topic. You will understand this more if you continue reading below.

If I had done five iterations instead of four, I might have ended up with 50,000 nodes or more, which is more than I wanted for this dataset, and would query Wikipedia's API harder than I wanted to do. You should start with two iterations, check your results, and then increase RESPONSIBLY. 

Network Analysis

I created a second notebook (which is nearly a duplicate of Day 4 but with today's data) for analyzing this network data. You can see the code/notebook here!

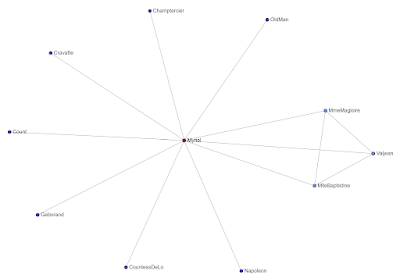
Previously, we used the Les Miserables network to learn a few fundamentals. From now on, we will use Wikipedia networks, as they are complex and more meaningful than character names. We can literally use the node names to continue our research into any topic of interest. 

Today's created network is far more complex than Les Miserables.


Complex real-world networks often look like this, when rendered. This looks useless, like a big spiderweb that we cannot hope to pull insights out of, except maybe a few of the peripheral nodes sticking out, but that is completely wrong. A lot of people get stuck at Whole Network Analysis (WNA), and this series will absolutely show you how to pull insights from any network, simple or complex.


The network is made up of 9,204 nodes and 14,140 edges. That's not bad for about 20 minutes of querying Wikipedia!

For today's update, the edgelist generator is the most important thing, as it is useful and we will use it to create interesting datasets during the course of this adventure. I have other topics in mind that I would like to understand.

Today, I chose the four 'seed searches' because they are all related:

  • Network Science is a broader domain, like Data Science
  • Social Network Analysis falls under Network Science
  • Graph Theory was the origin that led to Network Science
  • Causal Inference uses directed graphs to infer causality

I was especially interested to see the overlap between Causal Inference and the rest, and I will explore that in later days.

The generator itself requires some understanding, so I will keep the analysis light today. We will just look at a few ego networks, and discuss what we can see and do with the information.

It is always useful to look at Page Rank and centralities, to identify important nodes. That is always a good place to start after a graph has been constructed.


Very cool. We can see that the page "Glossary of graph theory" has a drastically higher Page Rank value than anything else. Let's take a look at the ego network for that node.

This is a complex ego network! There is a lot of connectivity between the alter nodes, and this is not at all a star network! This is a complex ecosystem of information having to do with Graph Theory. But this is hard to read. Check out the Jupyter notebook and you will see how to get a list of nodes.

What nodes have we uncovered? What interesting Wikipedia pages and topics have we found? Let's take a look. Here are just the first twenty nodes out of seventy-seven:

  • Acyclic graph
  • Arborescence (graph theory)
  • Biconnected graph
  • Bipartite graph
  • Block graph
  • Bridge (graph theory)
  • Cheeger constant (graph theory)
  • Chordal bipartite graph
  • Chordal completion
  • Chordal graph
  • Circle graph
  • Claw-free graph
  • Clique (graph theory)
  • Clique graph
  • Complete bipartite graph
  • Complete graph
  • Component (graph theory)
  • Cubic graph
  • Cut (graph theory)
  • Cycle (graph theory)

Very cool. I can already see several things I have never heard of. This could lead me down some interesting rabbit holes of discovery and education. Each of these is a separate Wikipedia page, and you can also search other sources on the internet, such as Arxiv. Let's look at more interesting ego networks.


Here's the ego network for "Graph (Discrete Mathematics)". You could do the same thing with this one: extract interesting topics, and then go learn about them. Let's look at another.


I thought this one was interesting as well. There's a lot I've never heard of that make me curious to learn more. Let's look at another.


This (above) is the ego network for "Graph Theory", one of the original searches. There's lots of interesting topics, and even a page relating to Graph Databases.


Here's a cool ego network relating to Artificial Intelligence. I can see cool topics such as Causal AI, Social Intelligence, Philosophy of Artificial Intelligence, Ethics of Artificial Intelligence, and more.


Apparently, one of the picked up Wikipedia pages had to do with fallacies and that ego network is interesting as well. This would be a very interesting rabbit hole to continue down. Perhaps it might be interesting to use "List of fallacies" as a seed search for the edgelist generator and see where it leads us. Maybe I will do that on another day.

What's the Takeaway?

I've long said that the internet is a goldmine for discovery and analysis, if you learn how to use it as such. That is the reason for my obsessions in Natural Language Processing and Network Science. Natural Language Processing gives me answers regarding content and context. Network Science helps me understand relationships and flow.

What I've demonstrated today can be a very useful tool for anyone to use for learning. You don't have to use my seed search terms. You can use your own. You could research any topic at all that interests you. For instance, I will use this to build a network relating to some of my favorite scientists and science fiction authors.

I want to encourage you to JUMP IN and try this stuff out. It feels good to create your own networks and do your own network analysis. You can share edgelists with the community, and you can discover insights that you would likely not discover, otherwise.

And now, we have a tool that we can use to make this #100daysofnetworks adventure a lot more interesting, beyond using stale NetworkX network generators (Les Miserables, etc) or other people's datasets. Research what interests you, and then use that data to build skill. Then the skill sticks, and you learn neat things in the process.

If you would like to learn more about networks and network analysis, please buy a copy of my book!

Sunday, July 16, 2023

Day 4 of #100daysofnetworks

 Welcome to day 4 of #100days of networks. 

If you would like to learn more about networks and network analysis, please buy a copy of my book!

You can find the code for today's exercise here.

Today, I am going to show you how to ZOOM IN on any part of a network. We've made good progress on this adventure, so far, and we're following a logical path.

  • Day 1: We discussed expectations for this journey
  • Day 2: We covered network basics and did whole network visualization
  • Day 3: We talked about centralities and other ways to identify important nodes and edges
  • Day 4: We are going to learn how to zoom in on those important nodes

Why would we want to ZOOM IN on important nodes? Well, there are different ways to look at any network:

  • Whole Network Analysis (WNA): you can learn about the overall shape and size of a network. All networks are unique. Even the same network will be unique, if looked at temporally, as networks evolve over time. Whole Network Analysis is just a snapshot in time.
  • Egocentric Network Analysis: this is what we are doing today. Zooming in on individual nodes will tell you about an ego node's connections (alters), and a bit about alters' connections too.
  • Community Analysis: If Whole Network Analysis is at the WHOLE NETWORK scale, and Egocentric Network Analysis is at the NODE neighborhood scale, then community analysis is zoomed out a bit from Egocentric Network Analysis. In community analysis, I'm looking at groups of nodes. I am less interested in single nodes. I am more interested in how nodes behave together, or collaborate.

But today's discussion is on Egocentric Network Analysis. We are going to ZOOM IN on nodes of interest. That is the simplest way to think about Egocentric Network Analysis. It is less complicated than it sounds.

Whole Network - Spot Check

ALWAYS, it is a good idea to start any network analysis by doing Whole Network Analysis. However, we've looked at this network many times and know that it is small and simple enough to visualize, so let's do that, and use our eyes for insights.


This should look familiar. We've looked at this a few times by now. You should be able to see a few key nodes and a few key groups, even without looking closer.

Next, I am going to show you how to "zoom in" on any node in the network. Scroll up and try to identify all of Claquesous's connections. It's very difficult to do, because he is part of a denser area in the network. For this, we need to be able to look closer.

The best first option for looking closer is to look at a node's Ego Graph. In an Ego Graph, the node of interest (Claquesous) is in the center, known as the ego node. All of the node's connections are shown as connections around the ego node, and they are known as alters. The two things to keep in mind: ego and alters. The ego is in the center, the alters are around it.

A very cool thing that can happen in an Ego Graph is that you will also be able to see alters' connections to other alters. Rather than an Ego Graph simply being a star, sometimes there are other connections that can be interesting. In those cases, you can look closer with your eyes, or you can take another approach, which I do often: drop the center, and the alters will show as isolates and small groups.

I will attempt to show all of this in this notebook. First, let's use PageRank to identify the most important nodes in this network.


In the code, I show an easy way to extract a list of the top N nodes and use them for Egocentric Network Analysis in our next steps. I also show how to do each of the individual visualizations shown below. Please get to know the code, and try it for yourself!

Now, let's look through the top five characters shown in the above visualization.

Valjean

Here is Valjean's Ego Graph. 


Even without clicking the image for a closer look, I can see that there is one CENTER node (ego: Valjean) and lots of peripheral nodes (alter nodes). I can see that this is not a simple star network, but that there is some clustering on the center left, bottom right, and top center right. These are groups that exist in this Ego Graph. 

When an Ego Graph has plenty of complexity and is interesting to look at, one of my favorite tricks is to DROP the center. By doing this, it drops the ego node (Valjean) out of the graph, causing the graph to shatter into pieces, exposing the groups that exist in the graph. Let's do that.


Even without clicking the image to look closer, I can see that the center node is gone and that the network has shattered into pieces. When a network shatters into pieces, it often exposes some of the things I've talked about previously:

  • Connected Components: there are often several clusters of nodes still linked together. Above, I can see one large cluster on the left, and one smaller cluster on the top right. Look for a few dots situated closely together on the top right. That's the second group.
  • Isolates: there are also often several isolate nodes, which are nodes with no connections whatsoever. Above, I can see five isolate nodes. They were only connected to Valjean. With Valjean removed from his own Ego Graph, these nodes became isolates.

But most importantly, we've identified that Valjean is connected to two separate groups. The differences between these groups could make for interesting analysis. Why are they not connected? What do they do differently? And why are none of the isolates connected to anything else? What makes the isolates so utterly unspecial or special that nothing is connected to them?

Let's keep moving. I am going to do the same for the next four important characters. We could do this for every single node in the network, and it would take a very long time to analyze, but a tremendous amount of learning could be done about the story of Les Miserables if network analysis was used along with content analysis to dig deeper. Thus, the marriage of Network Science, Social Network Analysis, and Natural Language Processing is special and important to me. Moving on.

For these next characters, put your thinking caps on. Look at the images and try to answer the questions I ask.

Myriel


Myriel's Ego Graph is almost a star network, but there are three characters on the right who are connected with each other. Myriel has a high PageRank score because of the number of edges, but Myrie's Ego Graph is very simple. If we drop the center node, what do you think will happen? How many isolate nodes do you think we will see? How many groups will we see?


As expected, dropping the center node shattered the network and left one small group and several isolate nodes. I can see seven isolate nodes and one small group. What is this small group that Myriel was a part of? What do they believe and do? Who are their members? How do they know each other?

Gavroche


Like Valjean, Gavroche has a very interesting Ego Graph. I can see the one center node. How many groups do you see? A group can be two people. If we drop the center node, how many groups do you think we'll be able to see? How many isolates?


This graph actually tricked me. I expected that there'd be three groups, but that is because I simply was not looking closely enough. In the earlier image, It looked like there were three groups: top left, bottom left, and bottom right. There are three groups. However, a few people in the bottom group had connections with the top group, so dropping Gavroche was not enough to split these two groups. They have some cohesion. 

Did you guess the number of groups correctly? How about the number of isolates?

One of the groups was Child 1 and Child 2. What is their relationship with Gavroche?

What is the isolate's relationship with Gavroche?

Finally, what is this larger cluster of characters? Why are two groups linked together, with or without Gavroche? Who are these people? How would the absence of Gavroche in the story affect these characters?

Marius


Marius' Ego Graph has some interesting complexity as well. I can see at least one densely connected group of nodes on the top left, and I get the feeling that this is actually two separate groups of people but that there is some cohesion with the top left group. I expect that this network will not shatter if we drop the center node and that there will be no isolates. What is your bet? Try to draw a mental picture of what will happen after Marius is dropped.


As I expected, the group remained intact, even with Marius removed. Valjean is an important node in this network, and he has helped keep it together, along with others. 

Who are these people? How do they know each other? Why is this network so resilient? If these characters are important, what would it take to eliminate their ability to work together? On the other hand, what would bolster the network? 

Javert


Javert's Ego Graph is the last we will do today, but we could go much further. Feel free to learn from my code and investigate every node in the network. It's a great way to explore and learn!

What do you see? I see to central nodes: Javert and Valjean. I see one group of nodes on the left, and they are connected with both Javert and Valjean. I see some characters on the right who have connections to characters on the left. Because of all of this, if the center node is dropped, I suspect that this network will be resilient and not shatter. Because none of the nodes have fewer than two edges, I expect we will have zero isolates, because 2 - 1 = 1. Every remaining node will have at least one edge to another node. The network will remain intact. Essentially, this is a large group of connected individuals.


As I suspected, the network did not shatter. After dropping the center node, all remaining nodes are still connected with other nodes. The dense group is a little more discernable.

What is this group? Why are two very important characters so central in this network? 

What are the Takeaways?

It is fun to explore any kind of social network, no matter the topic. You can learn a lot about any topic by exploring the social networks that exist inside that topic. In today's exercise, the topic is Les Miserables. We could have taken the raw text of this story, used the techniques from my book, and literally converted raw text into an explorable network. We can use the text of the book alongside the network to learn more about individual communities, and I will show how to do this at a later date. This is new material that is not included in the first edition of my book.

This exercise also showed that different shapes of networks are more resilient to attack. For instance, if you take a star network (the second character) and drop the center node, the network shatters into pieces. If you take a more densely connected network and drop even the most important node, the network can still remain intact. What are the implications of that for cybersecurity, for leadership, for national security, for teamwork, or for your own life? What fragile networks exist in your own life? What resilient networks exist in your own life?

For instance, in my own life, I am part of the LinkedIn Data Science community, and regularly post content and participate in conversations. That is a densely connected network, and that network would not be affected by my absence, or any one person's absence. It would just continue to grow and evolve. That's a resilient network that exists in my life. How about a fragile network? I have very few friends I hang out with in person. In a small group, if one person is removed, the effect is devastating on the group.

Let's Zoom Out a Little

I hope you have learned a bit from these discussions. We've already covered enough material for you to jump into network analysis. We haven't talked at all about network construction, but we've found a network to use and learn from. I promise, very soon, we are going to construct our own Graphs, not use something pre-made. I enjoy using networks to explore reality, not just use someone else's networks for learning. 

We've learned how to construct a graph, render visualizations, identify important nodes, and zoom in on important nodes. These are fundamentals that you need, and you have them now, and we're only on day four. Getting the fundamentals out of the way in the beginning will leave us with a lot more time to explore. 

What are you waiting for?

If you find this content interesting, please jump in and give this a try! Install Jupyter or use Google Colab and start exploring. You don't need to know everything on day one. Just get started. Learning to work with networks and explore relationships is powerful, and this skill becomes tremendously useful the deeper you go.

That's Enough for Today

I hope you found this to be an enjoyable read, and I hope my explanations made sense. This blog post was written quickly. If you would like to learn more about networks and network analysis, please buy a copy of my book!


Saturday, July 15, 2023

Day 3 of #100daysofnetworks

Welcome to day 3 of #100days of networks. 

If you would like to learn more about networks and network analysis, please buy a copy of my book!

Today, we are going to talk about CENTRALITIES. Network Centralities are a useful tool to quickly identify interesting nodes (people, things, etc) from any network. Once you have built a graph, you should use centralities to get a lay of the land, to "learn the main characters", so to say.

In today's exercise, we will use the Les Miserables graph from NetworkX, to keep things simple.

You can use my Github code to follow along.

Here is a bit about centralities:

  • Degree Centrality: Importance based on the number of degrees (edges)
  • Betweenness Centrality: Importance based on whether a node sits between other nodes; Information flows through them. Can also be gatekeepers. They have power.
  • Closeness Centrality: Importance based on a nodes closeness to other nodes. Has to do with number of steps away.
  • PageRank: Importance based on number of inbound and outbound edges. Inbound is more important than outbound.
  • There are many, many, others.

In today's exercise, I will show how to use the above, as well as another algorithm called HITS, which is used to identify hubs (many outbound edges) and authorities (many inbound edges).

These are what I consider "starting centralities", in that I always use them, for any graph, to get a lay of the land, so to speak. However, use will depend on the scale of the network. If you are below million scale, then all of these should work, but betweenness and closeness will gradually slow down to the point of being impractical. If you are above million scale, PageRank will be your go-to algorithm. PageRank was created by the founders of Google and it scales well. Betweenness and Closeness Centrality do not scale well, but they are very useful on smaller networks, or on subsets of networks.

Network Spot Check

Before doing anything with any network, it is useful to do a few spot checks. For instance, it is useful to know the size of a network before choosing algorithms for working with the network. However, I have used this particular network several times and know that it is small and that none of today's algorithms will have any issues with a network of this size, so let's keep going. I'll show you how to get useful network metrics for Network EDA (exploratory data analysis) on another day. 

For today, as this is a small network, let's just visualize it.

This will do nicely. Click on the image to look closer. What insights can we gather simply by LOOKING at the visualization?

  • Valjean is clearly an important character. He sits in a very central position in the network, and there are complex relationships that exist around him, shown by the network structures (clusters) nearby. To get from one side of the network to the other side, paths go through Valjean.
  • Gavroche is another important character. He is well-connected to very dense parts of the network, but more connected than others.
  • Myriel is another important character, as indicated by the different node color.
  • There are several clusters of densely connected nodes. These clusters form interesting communities and should be explored both as a single entity, but also at the single node level. How do individuals in these communities behave? How do the communities as a whole behave compared to the rest of the network? What sets them apart?
  • There are many nodes with a single edge. These are support characters. Napoleon is one. Napoleon is an interesting character in history, but is only linked to a single character in the book.
  • There are no isolates in this network. Isolates are nodes without any edges. They will show in a network visualization as just a dot, orbiting on the outside of a visualization. Network visualization software typically keeps them away from the connected parts of a network.

Nice, so we can see a few things:

  • There are important nodes
  • There are communities (community detection will be useful; we will cover it later)
  • There is only one giant cluster in this network. Often, in real-world networks, there will be several complex and large ecosystems that exist. Because there is only one big structure in this network, our work will be easier.

But today's exercise is about centralities, and this was just the spot check. Let's keep moving. This spot check looks good. We can see the network, and this network is small enough that we can use our own eyes for insights. But let's use algorithms to make our work easier.

I'm going to keep my descriptions as simple as possible. If you are interested in the math or research behind these algorithms, please check the links below, and read the research papers mentioned on NetworkX.

Degree Centrality

Here is more information on Degree Centrality.

Degree Centrality has to do with the number of degrees (edges) that nodes have. For instance, if most nodes in a network have 1-3 edges (lines), and a few have (20-30), then those few nodes are probably very important. Because for some reason, they sure have a lot of connections. 


Here are the top ten characters by Degree Centrality. 

We were able to use our eyes to see that Valjean and Gavroche were two of the most important characters, based on their position in the network, and this shows the same. It also tells us other important characters that we should look into.

Degree Centrality does not care about the direction of edges (lines) from nodes to other nodes. It just has to do with the total count. It is direction agnostic.

Degree Centrality should work well on graphs of any size. I have used them at million scale. It should work at billion scale.

Betweenness Centrality

Here is more information on betweenness centrality.

Betweenness Centrality is actually my favorite centrality, because it has to do with information flow. Let's pretend there are three people (A, B, C).

A - B - C

In order for Person A to share his idea with Person C, he needs to go through Person B.

In the same way, if Person C wants to share her idea with Person A, she will need to go through Person B.

Person B is very important in this situation, as all information must go through that person.

Betweenness Centrality has to do with paths that flow through nodes. For instance, For Person A to talk to Person C, the path goes A -> B -> C. For Person C to talk to person A, the path goes C -> B -> A. In a network with any complexity, there are many paths, and these are used in calculating Betweenness Centrality scores.


These are the top ten characters by Betweenness Centrality. Look at this visualization, and then compare it to degree centrality. Notice how different Valjean's betweenness centrality is from everyone else's. Also notice that Gavroche is not in the second position for Betweenness Centrality. Myriel holds that position. Find Myriel in the full network visualization and try to see why. 

Betweenness Centrality slows down as networks grow in size, as there are more nodes, more edges, and thus, more paths. It is a useful algorithm at thousand scale, but once at million scale, you might want to use PageRank as your primary algorithm for determining node importance. At thousand scale, I like to use Betweenness Centrality AND PageRank as my primary algorithms for importance. I use PageRank at every scale.

Closeness Centrality

Here is more information on closeness centrality.

Closeness Centrality is another algorithm that uses paths in its calculations, like Betweenness Centrality. That means that it suffers from the same problem. It is useful on small networks, at thousand-sale, but it is impractical for million or billion scale.

However, this is a very useful measure. It indicates nodes' closeness to other nodes. Put another way, is a node in the city, or out in the woods? A persons opportunities are partially dependent on environment.

Personally, I always include this measure in my analysis, but it is more for added context, and less useful to me. Other measures give me more valuable insights (such as Betweenness Centrality). But I always include this, for context.


In terms of closeness, Valjean and Marius are in the first two positions, and Valjean stands out compared to the others. The others are pretty similar.

PageRank

Here is more information on PageRank.

PageRank is extremely useful. It was created by the founders of Google and part of how Google search worked. PageRank has to do with inbound and outbound links, so directionality is implied, but it also works well with undirected networks. Our Les Miserables network is undirected. 


PageRank clearly identified Valjean as the most important character, with Myriel in distant second place, and Gavroche in third.

PageRank is a great algorithm for importance. In my experience, it is always useful. Get used to including it in your analysis.

PageRank was created for the internet, which is a BILLION SCALE network. PageRank works well at any scale.

HITS

Here is more information on the HITS algorithm. 

HITS is a very cool algorithm that identifies hubs and authorities. Hubs are nodes that have many outbound links, and authorities are nodes that have many inbound links.

For instance, if a website is linked to by ten thousand websites, then that website is possibly an authority on whatever content they publish. Or, on social media, if an account is retweeted by a million other accounts that account is possibly an authority on whatever they talk about. However, that is in an ideal world. We live in a world of artificial amplification, where bots and blogs provide artificial amplification, but that is for another day.

A hub, on the other hand, has many OUTBOUND links. For instance, there are some cool websites that link to the weirdest news on the internet. One website might link to one thousand websites. One website is sending internet traffic to one thousand parts of the internet. That one website is a HUB.

Authorities: many inbound edges (lines, links).

Hubs: many outbound edges.

Today's network is undirected, and this algorithm needs a directed network to be most useful. However, it will still work with an undirected network, just the two result sets will be identical. 

Here are the two visualizations:


Notice that the two visualizations are identical. If we did this with a directed graph as input, the two visualizations would be distinct and more useful.

This algorithm isn't particularly useful today, but it will be useful with any directed network. And even though it was unable to discern hubs vs authorities, it still identified Gavroche and Valjean as the two most important characters, based on network position.

So, which is better?

Ok, cool. So, we looked at a few choice measures for centrality, but which one is the best? NONE OF THEM ARE THE BEST. They have different uses. Personally, if I have to pick only one, I'll use PageRank, but PageRank doesn't say much about betweenness or closeness. If I'm in a situation where I will only pick one, it's typically a scalability issue. PageRank does well at any scale, and Closeness and Betweenness Centrality do not. Degree Centrality easily scales. Certain algorithms work at even billion scale, and some become unpractical beyond thousand scale.

None of them are better, but you should know several, what they do, and where they do not work well.

My networks are billion scale, so I am usually looking for algorithms that scale well. However, it would be a total rookie mistake to write off any algorithms simply because the network is too large. For instance, you can extract a subset of a massive network and then all algorithms will be useful. And, as I mentioned before, most networks have several large clusters, so networks are commonly analyzed in pieces, anyway.

Final Takeaway

There's something you should keep in mind with regards to using centralities, PageRank, HITS, and other algorithms for determining node importance. Importance is calculated based on a nodes placement in a network. It has to do with position and surroundings, but this is network context.

It is important to think from a network perspective, but do not forget that the network is just the map. Just because two people are connected does not mean they are equally influential. One of them might be stupid and ignored, just tolerated. One of them might be less connected bully, but influential by might. One might be more influential in terms of messaging. And there are always other layers to the network that have not been built into the network. For instance, if a person from one end of the network etched something into a tree and a person from the opposite end of the network read it, then information flowed in another way.

These are tools that are useful from a network perspective, but there is more to the story.

What are you waiting for?

If you find this content interesting, please jump in and give this a try! Install Jupyter or use Google Colab and start exploring. You don't need to know everything on day one. Just get started. Learning to work with networks and explore relationships is powerful, and this skill becomes tremendously useful the deeper you go.

That's Enough for Today

I hope you found this to be an enjoyable read, and I hope my explanations made sense. This blog post was written quickly. If you would like to learn more about networks and network analysis, please buy a copy of my book!

Sunday, July 9, 2023

Day 2 of #100daysofnetworks

 Welcome to day 2 of #100days of networks. 

If you would like to learn more about networks and network analysis, please buy a copy of my book!

Today, we are going to start with the WHAT and WHY behind understanding networks. I'm going to explain what networks are, where we can find them, and why they are useful to explore, analyze, and understand.

Let's do that, real fast, and I'll discuss deeper in the remainder of this post.

  • WHAT: a network is just a manifestation of things and their relationships
  • WHERE: networks are all around us, and network data is easy to get.
  • WHY: being able to analyze networks gives us new ways to understand the world and universe.

You should study network analysis, because networks are everywhere, and learning how to do this will give you skill to be able to analyze and explore data in new ways.

Ok, back to the beginning. What even is all of this? What are we going to discuss during #100daysofnetworks? What am I going to discuss in this specific post? My plan is to start at the beginning, describing networks and parts of networks, and describing why you should care.

In this post, I will discuss the following:

  • What is a network?
  • What is a node?
  • What is an edge?
  • What is a community?
  • What is a subgraph?

If you read my book or followed along with the first iteration of #100daysofnetworks, then you probably know the answer to all of these questions, but I am hoping to introduce this topic to more people, so it is important to start at the beginning. Today's discussion will be about networks, their parts, and how they manifest in seemingly everything around us.

The point of this is to show how pervasive networks are and to explain that being able to explore and interrogate them gives us new abilities in understanding life and the world around us. Life is not flattened, structured data. Life is complex.

What is a network?

As mentioned above, a network is just a manifestation of things and their relationships. I'm sure that a more academic definition can be found, but at the end of the day, a network is things and relationships.

A graph, on the otherhand, is a representation of a network, for use in analysis, prediction, etc.

Often, I will use the terms graph and network as synonyms. That's common. People will often use the following phrases:

  • Graph Theory
  • Network Science
  • Social Network Analysis
  • Graph Data Science

There is so much overlap. I personally think of all of these as related. I apply Network Science when I am doing Social Network Analysis. I do not call what I do as Graph Data Science, but other people do. I like to keep things simple and just consider all of these as parts of Network Science, similar to how there are different domains in Data Science, or different domains in Software Engineering. That's how I think about all of this. 

A network is a manifestation of things and their relationships, and a graph is a representation of a network. That's how I see it. 

A network exists in the real world, and we often cannot know all of its parts. We can be aware that the network exists, and we can be aware of parts of the network, but we cannot see or understand everything. 

A graph is our representation of what we know of the network. Perhaps we have--on paper--created an edgelist after watching people's social interactions and hand-drawn the network of how people have interacted. We've created a graph. If we add arrows showing the directionality of the relationship, we've created a Directed Graph, etc, etc. 

But I slip up all the time. I'll have a whole day where I will call everything a network. Sometimes this is intentional. If in one sentence I call something a graph, and then in the next sentence I call something a network, a person may think I am talking about two different things. Or if they are from cybersecurity, they'll by default think I am talking about a computer network.

So, graphs, networks, they're synonymous to me, and I work with them every day. You can be more strict with yourself, if you like.

Regardless, networks exist in the real world and they are represented as graphs, and we can use graphs for analysis, prediction, and so on. Graphs are simultaneously a tool, a map, and a usable data structure. When they are visualized, they are often beautiful, like art.

Networks are all around us. Here are some examples, and we'll cover several of these during this adventure.

  • People Networks
    • Adversaries and Allies (Social Network)
    • Collaboration Network (Authors, Teams, etc)
    • Communications Network (Email, Tweets, Telegram, etc)
  • Computer Networks
  • Music Networks
    • Songs and Genres
    • Artist Collaborations
    • Song Evolution (Song -> Remix)
    • User Songs (for recommendations)
  • Data Networks
    • Entity Relationship Diagram (RELATIONSHIP is a giveaway)
    • Dataflow Diagram (Code -> Data)
    • Amplification (websites, social media accounts, etc)
    • Knowledge Graph

This is a very short list, just off the top of my head. What other kinds of networks can you imagine? 

Think about what we are doing when we try to 'network' with other people. We are attempting to start some kind of relationship with other people so that we can find opportunities. Analyzing networks is another way to identify opportunities or understand reality.

Here is a visualization of the social network from Les Miserables. 

Network visualization without labels

Here is the same network with labels.


What is a node?

As mentioned before, a node is a thing in a network. 


A node can be a person, a song, a food ingredient, an outcome, a computer program, a data file, a database table, etc. Use your imagination. A node is just a thing.

To keep things simple, hold the idea of a node as being a person or a computer. We all understand that human relationships are a thing, and we are all probably aware that computer networks exist. Computers are nodes on a computer network. People are nodes on a social network.

A node is shown on a network visualization as a dot or circle.

What is an edge?

An edge is a relationship between two nodes. Put another way, an edge is a relationship between two things. Put another way, things have relationships with things, and they are portrayed as an edge.

An edge is shown on a network visualization as a line. The edge is the line that exists between two nodes, the line that exists between two dots or circles.

I am one person. You are another person. If you are reading this, you are interacting with my words. We now have an author/reader relationship. 

We now have an author/reader relationship. I am one dot, you are another, and there is a line between us. In the real world, nobody can see that line, but it exists.

What is a community?

A community is a group of connected things. Typically, when we talk about communities, we are talking about living things. However, there is such a thing as communities of websites, communities of social media accounts, etc. We could say that that's because there are people behind those websites and people behind those accounts, and I'd agree with that. But community detection algorithms are useful beyond studying living things. 

I will show how to identify and visualize communities in the near future. We will use community detection very often.

To keep things simple, going back to our idea of people networks, a community would be a network of connected individuals. 

For instance, families are densely connected. We tend to interact with people we live with. Work networks are less densely connected, and there are clear cliques/communities that work together. If you were to construct a network of every single person on the planet, it would be sparsly connected, and it would also include communities. 

If you are reading this blog post, you are probably part of the IT community on LinkedIn, and the IT community has smaller communities for Data Science, Cybersecurity, Data Engineering, etc. 

Try to think about communities that you belong to, online and offline.

In a network, a community is a group of connected things. In life, we are connected to people we interact with.

What is a subgraph?

In a network, a subgraph is similar to a community. A community IS a subgraph of the whole graph/network. 

Let's keep this simple:

  • Graph: representation of the entire network
  • Community: connected things that are part of that graph; a smaller section
  • Subgraph: a smaller section of the entire graph

A subgraph is a smaller section of a larger graph. You can extract a part of the whole network for analysis, rather than working with the whole network.

And a community is also a smaller section of a larger graph.

But a subgraph does not need to be a community. For instance, if I wanted to see the subgraph of the whole graph that contained three nodes from community A and three nodes from community B, we'd likely end up with two separate networks. If you visualized it, you'd see two clusters.

A community is a subgraph, but a subgraph is not necessarily a community. 

For instance, here is a subgraph taken from the larger Les Miserables network.

We will explore subgraphs more throughout this adventure, as they are extremely useful.

That's Enough for Today

I hope you found this to be an enjoyable read, and I hope my explanations made sense. This blog post was written quickly. If you would like to learn more about networks and network analysis, please buy a copy of my book!

Saturday, July 8, 2023

Welcome to Day 1 of #100daysofnetworks!

Hello everyone! Welcome to day 1 of the 2023 edition of #100daysofnetworks!

As some of you are probably aware, this is the SECOND iteration of this adventure, with the first taking place in 2020. I learned so much from that first adventure, and I'm excited to do this again.

This first post is going to be a bit long, as I'd like to tell a bit about who I am and what I have in mind.

Who am I?

My name is David Knickerbocker. I am a software engineer. Since childhood, I have been obsessed with getting computers to do interesting things. As a child, I was excited when I could programmatically get them to make beep boop noises, and then became interested in creating ASCII art after that. As a teenager, I spent a lot of time building (and breaking) computers. As an adult, my earliest obsession was web development, but that has shifted to data engineering and then to data science. My entire life has revolved around working with computers and getting them to do what I want them to do.

My career has entirely been in Information Technology (IT), but this has led me to working as a web developer, SQL developer, database administrator, data operations (dataops) engineer, data engineer, platform engineer, and now I am chief engineer in a company I am helping build.

My entire career's emphasis has been to help people. This has led me to working in cybersecurity, in a hospital, in companies that help the U.S. Military community, and eventually to building a company to solve certain specific problems. For me, everything I do and build is about using technology to help humans. I don't care about cybersecurity for the sake of cybersecurity or because it pays well. Helping people is my central mission.

Now, my work is focuses around Natural Language Processing (NLP) and Network Analysis. The things I will discuss as part of this adventure are the types of things I work on at work. This isn't a hobby, it has real-world applicability for solving problems. These days, I am most obsessed with network and NLP insights. I enjoy using NLP and networks to map out relationship and to find hidden insights. The marriage of NLP and networks makes this possible.

Outside of work, I enjoy hanging out with my cats (Eddie and Echo), playing guitar, collecting fancy rocks and minerals, and playing video games.


This is Eddie. :)

Why am I doing this?

I launched the first iteration of this adventure in 2020, after completing more than 100 days of #100daysofnlp. During the NLP adventure, I noticed just how much network data was available in the wild, and how incapable I was at doing more than surface level network analysis. I decided that I wanted to go much deeper. After 100 days of Natural Language Processing, I had built up a lot of skill and confidence. So, I wanted to see how far I could go with networks.

The answer is that it took me very far. It took me so far that I got a book deal and a company out of it, and am now so comfortable with network analysis that it has become muscle memory.

However, I haven't been able to focus on learning new things about networks as I once was, and there is more that I have been wanting to explore, but haven't found time for, and haven't had a reason to commit. 

This adventure is my commitment to spending another hundred days (at least), learning new things about network analysis and network science. I am excited to see what I will learn, this next iteration, and I'm excited to get others excited about this stuff as well. 

This is a creative outlet for me, but it is also research. Things I have learned in the first adventure, I use at work, and they went into my book. Stuff I learn in this new adventure, I will use at work, and they will appear in the second edition of my book.

This adventure will lead to new insights and techniques, and it will build skill, confidence, and intuition, as well.

Finally, the last reason is selfish: I enjoy sharing knowledge. I enjoy talking about cool stuff I'm learning, and useful things I have learned.

What did I learn in 2020?

I can still remember day 1 of the earlier #100daysofnetworks. I had just completed #100daysofnlp and felt so inadequate in my ability to use large networks. The first days were very awkward, for me. I had been working with network analysis since about 2018, when I was using network science for understanding dataflows as a data operations engineer, but I had never analyzed of visualized networks with thousands of nodes. 

Back in 2018 or so, I had also built my first social network, using text from the book of Genesis as data. I wanted to do more stuff like that, so I did. I found that practically any text could be used for constructing networks. I wrote about that in my book. I will be showing more of that in this project. 

In 2020, I was still using networkx for network visualization, and I suspected that there were better libraries available. There's still no great way to visualize networks in python, but it's getting better. I've shown how I do it, in my book, and that'll be part of this project as well.

I learned so much from reading various books on Network Science, Social Network Analysis, and Natural Language Processing. I will do another post about my favorite books, in upcoming weeks.

I learned some cool stuff about network fragility, but didn't explore the topic much. I plan to go into that further during this next iteration.

And everything I learned, from my own experience before 2020 to everything I read about in 2020, I practiced those techniques, build skill and confidence, and described them in my book, and I use these skills in my company as well.

What am I doing differently in 2023?

Most importantly, I am setting this up properly.

As I have written a book on this, I've build up an understanding of how this can be taught from basics to advanced, and I will follow that path this time, rather than being so disorganized as I was before.


What is the plan?

I plan on teaching the following, in the following order, but I may jump around a bit, to keep this organized but still a bit flexible. 

  • Introductions - this post
  • Basics w/ networkx pre-made graphs
  • Open datasets
  • Building networks, manually
  • Building networks, automatically, using text
  • Creating datasets
  • Cleaning networks
  • Graph metrics (centralities, etc)
  • Connected components
  • Subgraphs
  • Egocentric Network Analysis
  • Community Detection
  • Network weakness and destruction
  • Tons and tons of playing with interesting datasets
  • Graphs and machine learning
I am open to requests, but won't always say yes. If there's something that you'd like explored, participate on LinkedIn and let me know what you are curious to see.

What else will be covered?

If I'm teaching anything related to networks, Natural Language Processing will be included. NLP and Networks go together like <two things you like together>. Peanut butter and jelly, peanut butter and honey, steak and pepper, classical music and heavy metal.

I will also be discussing Network Science and Social Network Analysis, and differences between the two, and how they are used together.

I would also like to dabble with causal discovery, but am still exploring and learning. I will do my best to include it in this adventure. We have time.

My first use of Network Science was in mapping out dataflows and identifying critical points. I haven't discussed that much, and I'd like to show how I do this. I wrote very briefly in my book about this, but can spend a day or few on it in this adventure.

Finally, Machine Learning and Data Science is a given. 

Final Thoughts

I think this is going to be so much fun, and it gives me a creative outlet. It's useful and therapeutic to have a creative outlet, and the structured approach will allow me to expand my knowledge on what I am interested in, and I'm excited to be able to share this adventure with you as well, so that others can learn from this and get excited.

Network Analysis is a useful skill. If you have any data at all, building skill in Network Analysis will very likely give you new opportunities and perspectives in using that data.

I am going to disable comments on the blog, so that I do not have to spend my time moderating this. Please interact with me and the data science community on LinkedIn! Please join https://www.linkedin.com/feed/hashtag/?keywords=100daysofnetworks and learn with us! Feel free to use the #100daysofnetworks hashtag for your own adventure, and follow along!

Finally, if you like what I'm doing, please buy a copy of my book. You will learn from me during this adventure, but I also put a lot of time and energy writing a book about it. And after reading, please leave a review on Amazon so that others will find my book! Thank you!

This Blog Has Moved!

This blog has moved to Substack! No more updates will be added to the blogspot blog. I will leave posts here but will not add new ones. New ...