This blog will hold the second iteration of 100daysofnetworks, held in 2023-2024. In this blog, I describe how to work with network data. There will also be Natural Language Processing involved as well.
So far, through the course of this adventure, we've already learned some useful things such as:
How to use internet resources (such as Wikipedia) to create network data that can be useful for learning network analysis.
How to create network graphs using this data.
How to identify important nodes in the network.
How to identify communities in the network.
How to explore ego networks in the overall network.
This is already more than enough to be very effective in network analysis. This is because it is useful to be an explorer of networks and graphs, not just a user of graph data. I consider these as things to explore, not just things to use. By that, I mean that graphs are more than just input data for Machine Learning models, and that whole network metrics (overall density, number of nodes, number of edges, number of triangles) is just really not all that useful, in reality. When I do network analysis, I am looking for things, and it is never just a count of edges, or count of triangles, or a count of anything.
With the above skills, we already know enough to get started exploring networks, so let's get away from the dry fact learning, and do something interesting. Let's use what we know and use it for MUSIC DISCOVERY! This is an excellent weekend activity.
I have one goal: I want to learn three to five new things about my favorite band. I specifically set that to three to five, because it is easily possible to spend hours and hours and hours digging through a network. You should set goals so that you have something to aim for, and so that enough is enough. You can always return to an interesting network.
Let's get to work!
Wilco! My Favorite Band!
My favorite band is Wilco. I have been listening to them since 1997. I love their folk/rock sound and their experimental nature. They aren't just folk music. They get almost jam band'ish at times. They play in chaos. But they are also really mellow, and I love their folk and rock roots. I play guitar, and I find their music approachable. I am insecure about my ability to play lead guitar, and their lead guitarists has a style and skill that is approachable, where other artists are much more difficult.
Here's a picture of Wilco I found on a Google search.
In the front is Jeff Tweedy, the singer and songwriter. He is easily my favorite songwriter and frontman.
Here's one of my favorite Wilco songs.
They're just a great band, and I love to listen to them when I need to relax. I love playing guitar along with them as well.
This time, the dataset was a little noisy/messy, so I used Wilco's "ego network" with a radius of 2 to create a purer Wilco graph. You can see how I did that in the code. I do not explain to do that in my book. It is a useful option for quick cleanup.
After creating the network graph, the first thing I usually do is inspect the core of the overall network.
This is one of the most interesting network cores I have seen in a long time. I saw a similar "split nucleus" (what I call it) when I inspected an NRA (National Rifle Association) graph a few years ago and could clearly see that there were two parts (politics + gun enthusiasts) in the network.
I can see that there are two parts to this core: there's the actual Wilco stuff on the top left, and there's a bunch of stuff related to Roger Wilco on the bottom right. Because of the name, Roger Wilco was pulled into the dataset while crawling, using "snowball sampling". When using snowball sampling, you're always going to get some stuff you didn't expect, and it can be seen as junk or as something interesting. To me, this is interesting, not junk.
Notice that it looks like this core would fly apart if someone took a pair of scissors and made a few snips in the middle. If we were to cut four edges, the network would cleanly split in half. We're going to actually explore network resilience soon and will play with that idea.
I look at the core of every network to understand what is influencing the network. The core are nodes that are most connected in the network. The core is the foundation, and it can say a lot about the overall makeup of the network.
But the core is not everything. Isolates (nodes with no edges) can be very important, too.
However, the core gives me an overall picture of what is driving this network.
Nodes of Interest
After looking at the core of a network, I want to understand which are the most important nodes in the network. This can easily be done using Page Rank or one of many of the different kinds of centrality measures that we discussed previously, such as Betweenness Centrality.
This is a small network of only a few hundred nodes, so I will use Betweenness Centrality (which is slow on massive networks) and Page Rank to identify important nodes based on their network positioning.
First, here are the nodes that Page Rank found to be most important.
And here are the nodes that Betweeness Centrality found to be most important.
Here is an opportunity to build intuition: Look at the images without clicking on them to look closer. Notice that Betweenness Centrality looks very different than Page Rank. Why do you think that is? For both of them, Wilco and Jeff Tweedy are the most important nodes, but in Page Rank, the values are very different, and Jeff Tweedy has a much lower Betweenness Centrality than Wilco does. This is a good research topic, for learning. Get to know the centralities. They will quickly become intuitive, with use.
With my goal of finding 3-5 new things about Wilco, I'm going to look closer and see if anything stands out, and turn it into a question:
Who is Glenn Kotche?
Who is Billy Bragg?
Who or What is Uncle Tupelo?
Who is Jay Farrar?
Who or What is Tweedy?
Who is John Stirratt?
Now we are entering the realm of open source intelligence (OSINT)! Let's find out who each of them is and how they relate to Wilco!
Glenn Kotche is the drummer in Wilco. Cool!
Billy Bragg made two albums with Wilco. I love these albums!
Uncle Tupelo was Jeff Tweedy's band before Wilco, from 1987 to 1994.
Jay Farrar was part of Uncle Tupelo, Jeff Tweedy's band before Wilco.
Tweedy is a band that Jeff Tweedy made with his son.
John Stirratt plays bass in Wilco and other bands.
Other than Billy Brag, I did not know about the rest of them! I struggle to memorize names, and I haven't kept up with the individual musicians in Wilco. So, already, I've identified two bands that might be cool to listen to (Uncle Tupelo and Tweedy) and found musicians that might be worth further exploration (Jay Farrar and John Stirratt). The goal of finding 3-5 new things is already met, and we are just getting started. That's real value, and amazingly quick insights.
Community Detection
Next, I use Community Detection, to see how Wikipedia pages link together to form network communities. I prefer the Louvain Method, but Karate Club has a Machine Learning model called Scalable Community Detection (SCD) that is also excellent. I show how to use that in my book, and we will use it later, in this #100daysofnetworks adventure.
Community Detection essentially separates a graph into a bunch of smaller graphs that can be explored separately. It is useful on massive graphs, to break them apart for separate analysis, and it is useful on small graphs as well, to detect the cliques and communities that exist.
In the code, you can see more communities, but I will show and talk through just a few, here.
This is the largest community in the network. The node for "Billy Bragg" stands out. The node is colored red because it has the highest Page Rank value, of all the nodes in this community graph. This community is related to the album Mermaid Avenue and Mermaid Avenue volume II. I highly recommend listening to those albums. They are great, especially California Skies and One by One.
It makes sense that this is the largest community in the network, as this is one of their older albums. The album itself is a beautiful tribute to Woodie Guthrie.
Let's look at another community.
This community is very useful to me, as it is related to the band Uncle Tupelo, who I have not listened to. It was Jeff Tweedy's band before Wilco, so I should check them out! My goal was to learn 3-5 things, and I have already learned five, but it looks like there are a few more things to learn!
Will I like the album Anodyne?
Will I like the album No Depression?
Are there other albums on Jay Farrar's discography page that I might like?
Will I enjoy the rapper IDK?
What is Day of the Doug? Is that a band or an album? Will I like it?
I'm not going to chase those answers down right now. Let's keep going! That gives me something to explore when I need new music!
Let's look at another community!
This community relates to the video documentary "I am Trying to Break Your Heart". If you enjoy Wilco after reading this post, you will love that documentary. It's got great footage, and I have probably watched it over a dozen times by now. This introduces me to some new names and brings up questions:
Who is Jay Bennett?
Who or what is Kamera?
What is the Conet Project? What's it about?
What other documentaries has Fred Armisen made? Will I like them? What is his most recent?
What is Sam Jones' Wilco photography like? Are any of his shots for sale? Are they affordable?
What is "What I Mean to Say is Goodbye"? Is this a movie, album, or what?
Who is Bill Fay?
Notice something. Everything that we explore in a network brings up more questions. Graph exploration can unveil a MOUNTAIN of insights. Keep a notebook next to you, or a way to keep notes on your computer. Networks are complex and gradually an overwhelming feeling builds up if you explore too long without taking breaks. Look around, write notes, look around more, write more notes, then walk away for a while and take a long break. Good network analysis isn't done in one shot. It is iterative. Find insights, ask questions, do more digging, repeat. Do this until you have as many answers as you need. There is no DONE. You are done when you have enough.
Let's jump to Ego Networks, as I had the most success working with them for this analysis, more than communities. Check out the code to see more communities!
Egocentric Network Analysis
With community detection, we were interested in how pages linked together to form a community of nodes.
With Egocentric Network Analysis, we are interested in seeing what nodes exist around a node of interest, and how they link to each other. The main node is called the 'ego node', and all other nodes are called 'alters' or 'alter nodes'.
In an "ego network", the node of interest will typically be in the center, and alter nodes will surround it. However, one of my personal techniques that I find useful is to DROP the center node, the ego node. By doing this, the ego network can split apart, revealing the distinct groups that exist in an ego network. For instance, if a person is both an athlete and a video gamer, their social circle might contain both groups, and they may not interconnect. That's one example.
Opportunity for intuition: what other combinations could cause a person's ego network to have different groups? Think hobbies, religions, dating life, education, etc. Humans are complicated.
Let's look some ego networks!
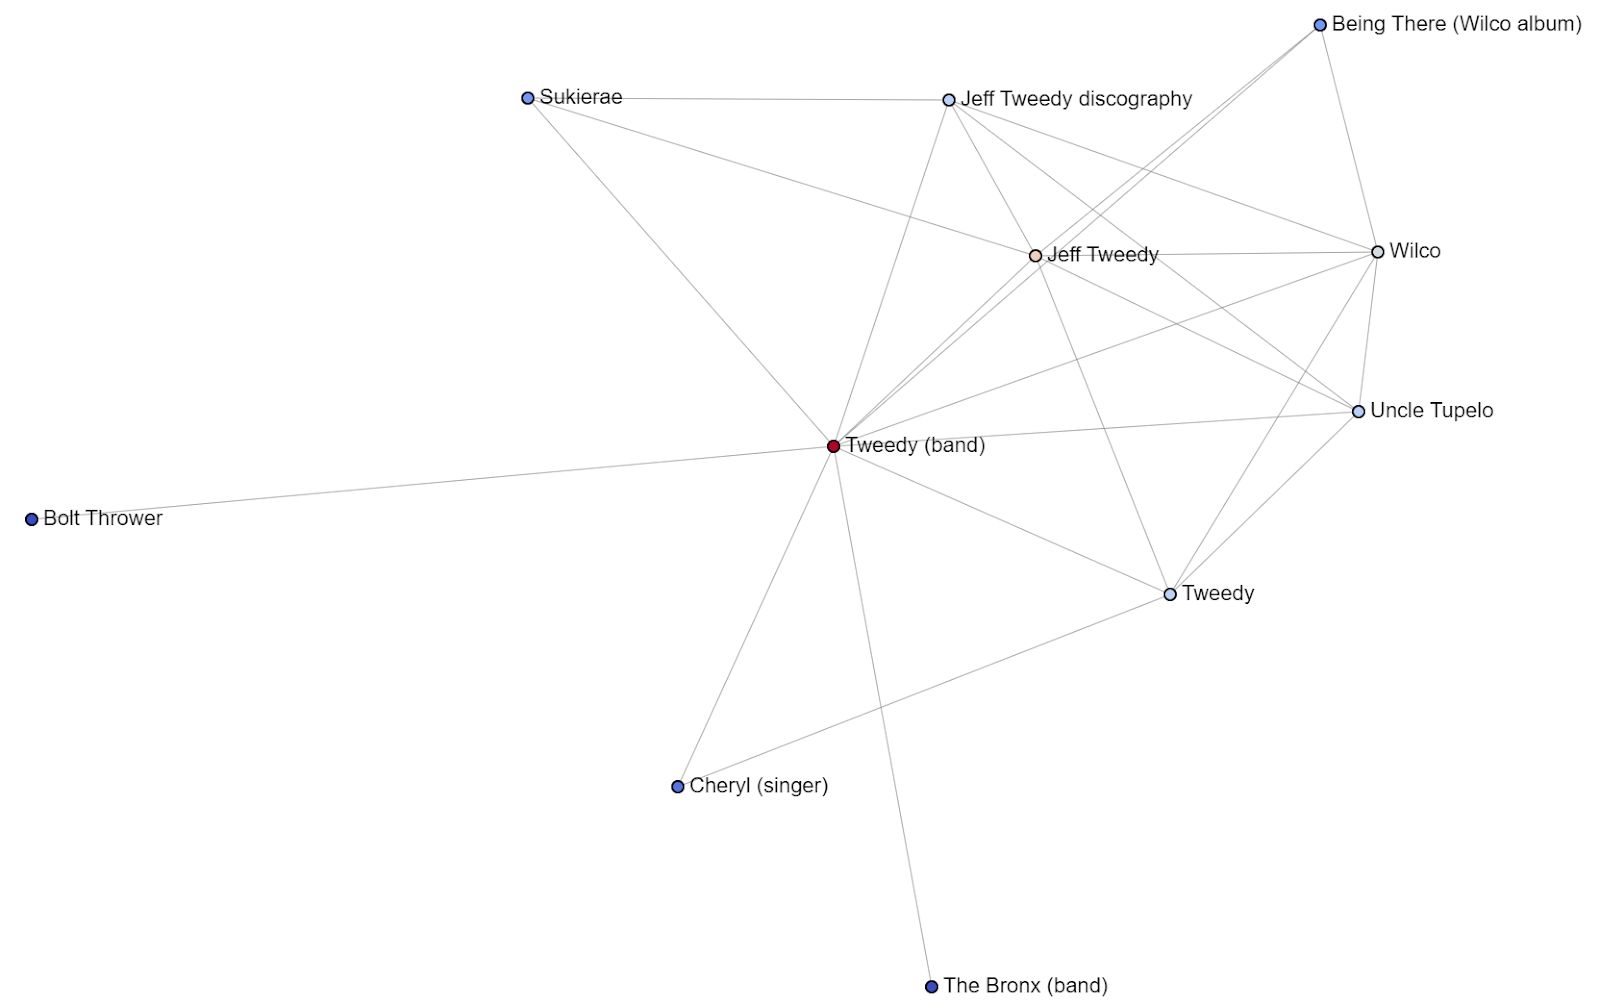
This is the ego network for Wilco. When I said that today I had better luck with ego networks than I had with community detection, this is why. With the ego network of Wilco, I get nodes that are linked to or linking to the Wilco page, so they are all relevant in some way. And this is a very interesting ego network, because there is so much cross linking between alters. That is not always the case in networks. We are lucky! I could easily find several things that catch my interest, but let's keep going.
This is the ego network for Jeff Tweedy. As he is the lead singer for Wilco, it is going to be very similar to Wilco's ego network. In fact, Wilco and Jeff Tweedy's nodes show different node colors indicating high Page Rank values. Jeff Tweedy is in Wilco's ego network, and Wilco is in Jeff Tweedy's ego network. Let's continue.
This is the ego network of the band Tweedy, Jeff Tweedy and his son's band. I had never heard of them before this analysis, and I started listening to them immediately. So far, I like them! I will definitely explore this, more. I enjoy playing music with my kids, so I find this network relatable and sweet. I need to know more. Also, what is that band The Bronx like? New music! Let's continue.
This is the ego network of the Wilco discography--Wilco's albums! I accidentally stopped keeping up with them around 2012, so which ones have I not yet listened to?
Star Wars: this is an album I have not listened to!
Schmilco: this is an album I have not listened to!
Ode to Joy: this is an album I have not listened to!
That's Enough!
And that's enough for one day! It is important to pace yourself when you do this kind of analysis.
My goal was to identify three to five new things I did not know about Wilco and I found many more than that.
What are the takeaways?
Networks and graphs are amazing exploratory devices for knowledge DISCOVERY
Networks and graphs are much more useful than in just Whole Network Analysis metrics (triangles, density, degrees, etc)
You can use OSINT to learn about GOOD things that interest you! OSINT isn't just for investigating bad or scary things! OSINT is literally knowledge discovery.
Everyone can use network data to learn about things. It is a choice to NOT use them. It is self-limiting to NOT learn to explore and analyze networks.
This was a fun post! Next post, I'll have some cool music to listen to while I am doing the work! I hope you enjoyed this!
Book Giveaway!
And for those who took the time to read this post, I am now going to announce a book giveaway! I am going to give away five copies of my book in digital and physical format.
Winners who live in the United States can receive either a signed physical copy (or unsigned) if they don't mind waiting a few days, or they can immediately receive a digital copy. I already have the digital copies ready for winners.
Winners who live outside the United States can receive a digital copy.
Hew is how to participate:
Find a topic of interest. For today's post, the topic of interest was "wilco".
Use the crawler from day 5 to create a network edgelist. Limit iteration to 3-4. Beyond that, if you are a beginner, it will be overwhelming. But I do encourage people to be bold in their learning.
Do network analysis like I did today. You can use today's Jupyter notebook as a template.
Create an "Insights Document" that has your findings. Use my blog posts for inspiration. You want to show some Whole Network Analysis findings, identify important nodes using Page Rank or Centralities, and look at a few ego networks. If community detection is difficult, skip it for now!
Message me the insights document on LinkedIn. I need to see your work and the insights you discovered. A Google document is easiest!
You don't have to be too thorough. Just do what you can. If you know nothing, then building a graph and finding important nodes is enough! If you know your way around networks, then push a bit further and show me what you can do!
I will accept submissions until September 30, 2023!
I will take all acceptable submissions and add them to a raffle. I will call out the winners on October 1!
And if you make your own LinkedIn post and tag #100daysofnetworks, I will add your name TWICE!
If a submission is not complete enough, I will ask for a bit more. I will try not to do that. Do the work, and you'll have a shot to win. Do the work.
Thank You!
Thank you for reading this post! I hope you enjoyed it! I wanted to do something a bit more interesting than usual, as it is important to do things that keep us creatively engaged. I look forward to seeing what you can do!
In Day 6 of 100 days of 100daysofnetworks, we converted our Network Analysis graph into an actual study guide we could use to learn more about networks and graphs!
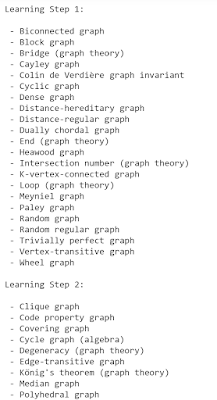
Today, I chose five types of graphs to explore from the study guide. You can see the study guide here. More specifically, today we are going to look at these five types of graphs:
Cycle Graph
Dense Graph
Sparse Graph
Regular Graph
Wheel Graph
I recommend that you follow along with the code, today, as it explains how I did this and what I see. This blog post will be kept high level. Follow the code!
We're not just going to LOOK at these kinds of graphs. I will describe their characteristics, and if you look at the Jupyter notebook, you can see how they differ from each other in terms of centralities and shortest paths.
Network Analysis is exciting, and it's good to learn about different types of graphs, so that we have a name for them when we see them in the wild. Let's begin.
I will use summaries from ChatGPT. As I mention in the notebook, if you use an LLM, you should validate the output. Let me know if you see any errors in the summaries. They look good to me.
Finally, we have not discussed density much in regards to graphs. Density has to do with the interconnectedness of a network/graph. If every node is connected to every other node, the network will have a density value of 1.0. If zero nodes are connected with any other nodes, the network will have a density value of 0.0. Density tells a lot about how connected the network is.
Cycle Graph
ChatGPT: "A cycle graph is a type of graph in network science that forms a simple cycle, which is a closed path where each node is connected to exactly two neighbors except for the first and last nodes, which are connected to each other. Cycle graphs are fundamental structures in graph theory and are often used to model cyclic processes, circuits, and other scenarios with repeating patterns.
In other words, in a cycle graph, nodes are connected to a single node to form a cycle.
For example: A -> B -> C -> D -> A
Here is the graph I built.
Notice a few things:
Nodes are connected to other nodes, forming a path in a single direction. A cycle would not exist if any of the arrows pointed the opposite direction. The flow would end on the first iteration.
It's a long way from nodes on one side of the network to nodes on the other side of the network.
It's not a dense network. Nodes are only linked to a single other node.
The structure of the graph also affects its centrality scores, as well. Every single node in this network has a betweenness centrality value of 0.5. No node stands out as being more important than any other node.
Shortest paths will be affected by the structure of this graph, as well:
To get from node A to node C, the shortest path is A -> B -> C
To get from node E to node C, the shortest path is E -> F -> G -> A -> B -> C
Shortest paths between nodes are not equal. This is not ideal for information flow.
If you wanted to make this more optimal for the flow of information between nodes, what do you think would help?
Dense Graph
ChatGPT: "A dense graph is a type of graph in network science where most of the possible edges are present, resulting in a high density of connections between nodes. In a dense graph, the number of edges is close to the maximum possible for the given number of nodes. Dense graphs are often used to model scenarios where interactions or relationships between entities are widespread and frequent."
In other words, in a dense graph, most nodes are connected with most other nodes. Here is the graph I built:
Notice a few things:
In this example, every node is connected to every other node. This will result in this graph having a density value of 1.0.
We could have dropped an edge and the graph would still have a high density value. It is a dense graph, even with one less edge, and would still fit the definition.
Even though I am showing arrows, they are bi-directional. This is not actually a directed graph. I am leaving arrow in for all of today's visualizations, to reduce code. It still makes sense and is correct. An undirected graph has bi-directional flow.
Even the visualization FEELS dense. There's a lot more going on in this graph than in the cycle graph.
The structure will also affect centrality scores. Check the notebook/code. Every node has a betweenness centrality of 0.0 and a degree centrality of 1.0. Essentially, all nodes are equally important, structurally.
However, compared to the cycle graph, this graph is optimal for information flow. The shortest path between each node will always be equal, because every node is connected to all other nodes. The shortest path from A to C is simply A->C, and the shortest path from E to C is simply E->C.
Sparse Graph
If the above is a dense graph, what do you think a sparse graph is? That's right. It is a graph where most nodes are not connected with all other nodes. It's the opposite of a dense graph. Here is an example:
Notice a few things:
Most nodes are not connected with all other nodes in the graph. In fact, zero nodes are connected with all other nodes in the graph.
There is SOME connectivity in this graph. There is some stuff happening. That is called a connected component.
There are lots of isolate nodes. Those are the dots. Dots are called isolates. They are nodes that have no edges with any other nodes. They can be very important, or not important at all, depending on the network you are dealing with.
This is a sparsely connected graph, or a sparse graph. It will have a very low density score. This graph has a density value of 0.027. The dense graph had a density value of 1.0. In the wild, you will mainly run into sparse networks, and that is not a problem. That is the nature of reality. Networks follow Power Law, or the idea that Rich Get Richer. A few nodes will have many edges, and most nodes will have few edges. A few humans will be billionaires, and most people will not. Etc.
Betweenness centrality can be very useful in a sparse network, as can Page Rank and other centralities. If you look at the notebook, notice the following:
Betweenness centrality found that one node was most important: node B. This is because it is the only node that sits between other nodes, or on the shortest path between other nodes.
Degree centrality found that four nodes were important (A, B, C, D), but that one node (B) was most important.
Shortest paths between nodes are also impacted by the structure of this graph. Scroll up and think about this: how would node E talk to node K?
The answer is that it cannot. No information flow can take place between nodes E and K, or E and any other node, because node E is an isolate. It has no edges.
How would node A communicate with node D? It would go A->B->D.
The structure of a network has real world impact in how freely information will move in that ecosystem. Ideas are shared in a dense ecosystem. Information is essentially firewalled in isolates. Nothing is shared from or shared to isolates.
Regular Graph
ChatGPT: "A regular graph is a type of graph in network science where each node has the same number of connections or edges. In other words, all nodes in a regular graph have the same degree. Regular graphs are often studied for their uniform connectivity patterns and symmetry."
In other words, a regular graph is a graph where all nodes have the same number of edges. Here is my example:
Our dense graph is also a regular graph, as all nodes have the same number of edges.
So, there will be a few things to keep in mind:
Density will be 1.0, as all nodes are connected to all other nodes.
Shortest path between all nodes will be the same. There is a path from any node to any other node.
Betweenness and degree centrality will have equal scores for all nodes, because none of them are different from each other, structurally.
This is simple enough. Let's keep moving.
Wheel Graph
I had never heard of or played with a Wheel Graph before today, so this was fun for me.
A wheel graph is identical to a cycle graph, but each of the outer nodes links to an inner node, creating what looks like a wheel. Here is my example:
Look closely and notice a few things:
Although this looks like a cycle graph, it is very different. All edges are bidirectional, not one-way, and there is one node in the center that connects to every other node.
This is an information flow optimization over a cycle graph, as all nodes are equal distance from each other. The optimization has to do with the central node being added and with the fact that all edges are bidirectional.
The density of this graph is 0.5. It sits between a dense graph and a sparse graph, right in the middle. There is room for many more edges.
In terms of centralities:
Betweenness centrality gives all nodes a value greater than 0, because all nodes sit between other nodes. However, one single node has a betweenness centrality that is 25x higher than every other node. Can you guess which one?
Degree centrality gives all nodes a value greater than 0, because all nodes have edges with other nodes. Degree centrality has to do with the number of degrees (edges) that a node has, and all nodes in this graph have edges. However, one node has more edges, and has been given a value about 2x higher than every other node. Can you guess which node?
So, both centrality scores were equally able to identify the most "central" node, but in my subjective opinion, betweenness centrality captures the relative importance better. Because if that node were dropped, information flow would be disrupted and shortest paths would be similar to the cycle graph where the distance from certain nodes would be far.
In terms of shortest paths, check out this image:
The shortest path between any node in this network is never more than three steps, because node H exists as a shortcut. To get from node A to node E, we can jump through H to get to our destination. Without H, we should have to go A->B->C->D->E.
Graph Structure Matters
I think of this as the structure of a graph, or the structure of a network. Different networks behave differently, and I hope I showed that today.
There are real-world implications to this:
If you manage a network of things, you can bolster that network by adding more nodes and edges. This is defense.
If you want to disrupt a sparse network, you can often shatter it (think Star Wars Death Star) by disrupting central nodes, nodes with high centrality values. This is offense. Removing a central node has a massive impact in sparse networks, and can completely isolate parts of the network. Think about what that means beyond graphs, to people and things.
Thank you!
Thank you for following along! This was fun! We've only done five of the graph types identified on day 6, and it was quite educational already!
In Day 5 of 100daysofnetworks, I created a Wikipedia crawler that could be used to investigate any topic that is of interest to you. You should really use it. It is a lot of fun to use and creates useful network data.
What do I mean by useful?
Well, today, I'm going to literally convert a graph into a learning curriculum for myself. I am going to take this:
And turn it into this:
In other words, I am going to turn a complex network into a clean learning curriculum that I can use to learn more about Network Science. I will use this to learn new things, and I will explore them during this series.
Network Spot Checks
True story. When I started working with networks, I got a lot of push back for using them as people could not understand how they could be useful. There is too much information in one visualization, and the more complex the network, the more difficult it is to visualize. Look at this mess (scroll up). How are we supposed to pull anything useful out of that ball of yarn?
It is not difficult if you know how. My book shows how, and this series has shown how as well. In the previous days, I've already shown a bit of how we can zoom in on parts of networks. For today's work, we are going to be zooming in on communities, but our final approach involves essentially "peeling the onion" layer by layer. I will show how. This is a cool technique, and not shown often. I will get to that after the Community Detection Work.
Community Detection Approach
One thing that I have found to be very useful is to look at content from a community perspective. Like attracts like. Pages that are related will link to each other, forming clusters, or communities.
Check out the code to learn how to do the Community Detection work. I'm only going to write about what I see in blog posts, not describe code.
This is the CORE of the largest community in the network. Pay attention to the k_core piece of code under the largest community and you will see that I am showing only nodes that have five or more edges. I only do that for this largest community. The other communities, I show completely as they are much smaller. Looking closer at this, I see many mentions of the word "graph". We are in the right place.
What other pages are part of this community? Let's see a list of only pages that are in this community.
Super easy. just like that, we can see the nodes that are part of any community, and in this case, this community is Wikipedia pages related to Network Science and Social Network Analysis. This is a clean list of relevant pages.
Here is another community:
Look closely! That is a computer science and computer graphics community. That community could actually be split into two communities, and there are only two bridge nodes holding the two communities together. See if you can identify them.
Let's look at another:
Look closely! This is a community that is related to Artificial Neural Networks. This would actually be a cool one to study, if interested in Machine Learning. What are some of the relevant nodes/pages?
This would be a pretty cool starting point for learning about Neural Networks. Let's look at another network.
That's really cool. It's a network of different sciences and how they relate to each other. This network would be interesting to use as seed nodes, and then redo crawling, to identify how various sciences are related. It is a small community, and incomplete, but it wasn't intentional for this to end up in the data, and that is very cool that it happened! One more!
This is a communication network network! This is related to network science, in that these can be analyzed with network science.
There are many more communities in the data, with a network this large. I encourage you to play with the data and to explore the networks. You will not learn this without practice. With practice, it becomes easy and intuitive.
I have shown that we can look at Wikipedia data not only from a whole network perspective but also from a community perspective, and the community level is a good way to hook onto the signal that you want. That's how I think of it, at least. Networks and data can be used together. They do not need to be separate things. They are powerful when used together.
K_Core and K_Corona
I use two techniques for exploring the layers of a network:
K_core allows me to see the core of any network, which helps understand what is most important or influential to a network. If you give K_core the highest degree value that it can handle, it will show the most connected nodes in a network.
K_corona allows me to PEEL THE ONION. Think of a network as an onion. K_corona allows me to peel the onion, one layer at a time, based on the number of degrees a node has.
Using K_core, I can see that the maximum depth I can go is six edges.
If I go past six, the code will fail. So, six is the number to keep in mind. Now that we have identified this using K_core, we will use the values [6, 5, 4, 3, 2, 1, 0] in K_corona to see all nodes that have exactly six edges, then exactly five edges, then exactly four edges, then exactly three edges, and so on.
Why?
Because I can use this to build a study guide. The most connected nodes are more important than the least connected nodes, in terms of learning. The most connected nodes have to do with other nodes, and understanding how things relate allows us to build a strong foundation. Studying fringe material is less useful, unless you are solving some fringe problem that it relates to. There is a time to focus, and a time to zoom out.
In the Jupyter notebook, I show simple code to convert the main Network Science community into a study guide. Please see that code.
As a result, I now have a clean list of stuff to explore and learn more about.
LISTEN CLOSELY. This can be done for any topic. I made available the Wikipedia crawler that can create the datasets to do this for any topic that you are curious about. For instance, I want to pull datasets about:
ALF - remember that show?
Science Fiction - A science fiction network would be awesome to explore
Work Topics
Companies I want to learn more about, and their relationships
People I want to learn more about, and their relationships
And so on. Network Science is all about RELATIONSHIPS between THINGS. Networks are essentially things and their relationships.
This madness:
Is really just a picture of THINGS and their RELATIONSHIPS with other THINGS. In this case, this is a network of TOPICS and their RELATIONSHIPS with other TOPICS. So, don't be afraid of networks or complexity. You just can't analyze these the same way as you would a spreadsheet or language.
Finally, if you are interested, I threw the study guide into a document and made it available for everyone. You can access it here.
Goal: Show Something Useful
My goal for today's post was to make and show something useful. Unless you have a reason to study networks, there never feels like a reason to study networks. Same goes for any topic. But here is the thing: networks are all around us, and network data is easily accessible, even if you have to generate it yourself. If you are creative, you can use this to your advantage. You don't have to use everything for work.
I have used networks to create vocabulary lists, building a network of Jane Austin's word use, and then extracting nodes with only a single edge (words only used once).
I have used networks to understand the flow of ideas across space and time.
I have used networks to troubleshoot server problems in minutes that used to take days.
I have used networks to study how malware evolves, and to use that to detect undetected malware.
And on and on and on and on and on.
I think in networks, because life is networks. Life is not spreadsheets. Life is not lists. Life is people and things and relationships.
So, I encourage you to learn to study networks, and this is a good place to start, as is my book, and I will recommend many other books during the course of this adventure.
Wikipedia Extras
In the Jupyter Notebook, I also included some code for working with the Wikipedia Python library. I show how to use it to pull summaries and text for any of the nodes in the Graph. I thought that might be useful to spark creativity.
Thank You!
Thank you for following along on this adventure! If you would like to learn more about networks and network analysis, please buy a copy of my book!
Today, I have a special treat for you! I created a Wikipedia Edgelist Generator that you can use for knowledge discovery on any topic that interests you. You can find the crawler / edgelist generator here!
I wanted to build a tool for knowledge discovery, and something that could be used no matter the topic to create complex networks that are more interesting than the small networks that come with NetworkX, and more interesting than using somebody else's dataset. To me, there is nothing more interesting than my own research, and I don't like using other people's datasets for learning. I prefer to analyze my own constructed networks, and do two things at the same time:
Improve my network analysis skills
Learn something about a topic of interest at the same time.
Today, I created the edgelist generator, and you may use it. I have added some guidance regarding iterations and sleeps at the top of the notebook. Please be responsible or Wikipedia will block your IP and you will get nothing.
Knowledge Discovery
The point of the edgelist generator is knowledge discovery, on any topic. For instance, to build today's dataset, I searched for four things:
Network Science
Social Network Analysis
Graph Theory
Causal Inference
If you look at the code on github, you will be able to see where and how I did that. After four iterations/loops of the crawling and edgelist generation, those four searches built a network of OVER 9000!!! nodes. That is why I call this knowledge discovery. Each of those 9000+ nodes is a Wikipedia page on a related topic. You will understand this more if you continue reading below.
If I had done five iterations instead of four, I might have ended up with 50,000 nodes or more, which is more than I wanted for this dataset, and would query Wikipedia's API harder than I wanted to do. You should start with two iterations, check your results, and then increase RESPONSIBLY.
Network Analysis
I created a second notebook (which is nearly a duplicate of Day 4 but with today's data) for analyzing this network data. You can see the code/notebook here!
Previously, we used the Les Miserables network to learn a few fundamentals. From now on, we will use Wikipedia networks, as they are complex and more meaningful than character names. We can literally use the node names to continue our research into any topic of interest.
Today's created network is far more complex than Les Miserables.
Complex real-world networks often look like this, when rendered. This looks useless, like a big spiderweb that we cannot hope to pull insights out of, except maybe a few of the peripheral nodes sticking out, but that is completely wrong. A lot of people get stuck at Whole Network Analysis (WNA), and this series will absolutely show you how to pull insights from any network, simple or complex.
The network is made up of 9,204 nodes and 14,140 edges. That's not bad for about 20 minutes of querying Wikipedia!
For today's update, the edgelist generator is the most important thing, as it is useful and we will use it to create interesting datasets during the course of this adventure. I have other topics in mind that I would like to understand.
Today, I chose the four 'seed searches' because they are all related:
Network Science is a broader domain, like Data Science
Social Network Analysis falls under Network Science
Graph Theory was the origin that led to Network Science
Causal Inference uses directed graphs to infer causality
I was especially interested to see the overlap between Causal Inference and the rest, and I will explore that in later days.
The generator itself requires some understanding, so I will keep the analysis light today. We will just look at a few ego networks, and discuss what we can see and do with the information.
It is always useful to look at Page Rank and centralities, to identify important nodes. That is always a good place to start after a graph has been constructed.
Very cool. We can see that the page "Glossary of graph theory" has a drastically higher Page Rank value than anything else. Let's take a look at the ego network for that node.
This is a complex ego network! There is a lot of connectivity between the alter nodes, and this is not at all a star network! This is a complex ecosystem of information having to do with Graph Theory. But this is hard to read. Check out the Jupyter notebook and you will see how to get a list of nodes.
What nodes have we uncovered? What interesting Wikipedia pages and topics have we found? Let's take a look. Here are just the first twenty nodes out of seventy-seven:
Acyclic graph
Arborescence (graph theory)
Biconnected graph
Bipartite graph
Block graph
Bridge (graph theory)
Cheeger constant (graph theory)
Chordal bipartite graph
Chordal completion
Chordal graph
Circle graph
Claw-free graph
Clique (graph theory)
Clique graph
Complete bipartite graph
Complete graph
Component (graph theory)
Cubic graph
Cut (graph theory)
Cycle (graph theory)
Very cool. I can already see several things I have never heard of. This could lead me down some interesting rabbit holes of discovery and education. Each of these is a separate Wikipedia page, and you can also search other sources on the internet, such as Arxiv. Let's look at more interesting ego networks.
Here's the ego network for "Graph (Discrete Mathematics)". You could do the same thing with this one: extract interesting topics, and then go learn about them. Let's look at another.
I thought this one was interesting as well. There's a lot I've never heard of that make me curious to learn more. Let's look at another.
This (above) is the ego network for "Graph Theory", one of the original searches. There's lots of interesting topics, and even a page relating to Graph Databases.
Here's a cool ego network relating to Artificial Intelligence. I can see cool topics such as Causal AI, Social Intelligence, Philosophy of Artificial Intelligence, Ethics of Artificial Intelligence, and more.
Apparently, one of the picked up Wikipedia pages had to do with fallacies and that ego network is interesting as well. This would be a very interesting rabbit hole to continue down. Perhaps it might be interesting to use "List of fallacies" as a seed search for the edgelist generator and see where it leads us. Maybe I will do that on another day.
What's the Takeaway?
I've long said that the internet is a goldmine for discovery and analysis, if you learn how to use it as such. That is the reason for my obsessions in Natural Language Processing and Network Science. Natural Language Processing gives me answers regarding content and context. Network Science helps me understand relationships and flow.
What I've demonstrated today can be a very useful tool for anyone to use for learning. You don't have to use my seed search terms. You can use your own. You could research any topic at all that interests you. For instance, I will use this to build a network relating to some of my favorite scientists and science fiction authors.
I want to encourage you to JUMP IN and try this stuff out. It feels good to create your own networks and do your own network analysis. You can share edgelists with the community, and you can discover insights that you would likely not discover, otherwise.
And now, we have a tool that we can use to make this #100daysofnetworks adventure a lot more interesting, beyond using stale NetworkX network generators (Les Miserables, etc) or other people's datasets. Research what interests you, and then use that data to build skill. Then the skill sticks, and you learn neat things in the process.
Today, I am going to show you how to ZOOM IN on any part of a network. We've made good progress on this adventure, so far, and we're following a logical path.
Day 1: We discussed expectations for this journey
Day 2: We covered network basics and did whole network visualization
Day 3: We talked about centralities and other ways to identify important nodes and edges
Day 4: We are going to learn how to zoom in on those important nodes
Why would we want to ZOOM IN on important nodes? Well, there are different ways to look at any network:
Whole Network Analysis (WNA): you can learn about the overall shape and size of a network. All networks are unique. Even the same network will be unique, if looked at temporally, as networks evolve over time. Whole Network Analysis is just a snapshot in time.
Egocentric Network Analysis: this is what we are doing today. Zooming in on individual nodes will tell you about an ego node's connections (alters), and a bit about alters' connections too.
Community Analysis: If Whole Network Analysis is at the WHOLE NETWORK scale, and Egocentric Network Analysis is at the NODE neighborhood scale, then community analysis is zoomed out a bit from Egocentric Network Analysis. In community analysis, I'm looking at groups of nodes. I am less interested in single nodes. I am more interested in how nodes behave together, or collaborate.
But today's discussion is on Egocentric Network Analysis. We are going to ZOOM IN on nodes of interest. That is the simplest way to think about Egocentric Network Analysis. It is less complicated than it sounds.
Whole Network - Spot Check
ALWAYS, it is a good idea to start any network analysis by doing Whole Network Analysis. However, we've looked at this network many times and know that it is small and simple enough to visualize, so let's do that, and use our eyes for insights.
This should look familiar. We've looked at this a few times by now. You should be able to see a few key nodes and a few key groups, even without looking closer.
Next, I am going to show you how to "zoom in" on any node in the network. Scroll up and try to identify all of Claquesous's connections. It's very difficult to do, because he is part of a denser area in the network. For this, we need to be able to look closer.
The best first option for looking closer is to look at a node's Ego Graph. In an Ego Graph, the node of interest (Claquesous) is in the center, known as the ego node. All of the node's connections are shown as connections around the ego node, and they are known as alters. The two things to keep in mind: ego and alters. The ego is in the center, the alters are around it.
A very cool thing that can happen in an Ego Graph is that you will also be able to see alters' connections to other alters. Rather than an Ego Graph simply being a star, sometimes there are other connections that can be interesting. In those cases, you can look closer with your eyes, or you can take another approach, which I do often: drop the center, and the alters will show as isolates and small groups.
I will attempt to show all of this in this notebook. First, let's use PageRank to identify the most important nodes in this network.
In the code, I show an easy way to extract a list of the top N nodes and use them for Egocentric Network Analysis in our next steps. I also show how to do each of the individual visualizations shown below. Please get to know the code, and try it for yourself!
Now, let's look through the top five characters shown in the above visualization.
Valjean
Here is Valjean's Ego Graph.
Even without clicking the image for a closer look, I can see that there is one CENTER node (ego: Valjean) and lots of peripheral nodes (alter nodes). I can see that this is not a simple star network, but that there is some clustering on the center left, bottom right, and top center right. These are groups that exist in this Ego Graph.
When an Ego Graph has plenty of complexity and is interesting to look at, one of my favorite tricks is to DROP the center. By doing this, it drops the ego node (Valjean) out of the graph, causing the graph to shatter into pieces, exposing the groups that exist in the graph. Let's do that.
Even without clicking the image to look closer, I can see that the center node is gone and that the network has shattered into pieces. When a network shatters into pieces, it often exposes some of the things I've talked about previously:
Connected Components: there are often several clusters of nodes still linked together. Above, I can see one large cluster on the left, and one smaller cluster on the top right. Look for a few dots situated closely together on the top right. That's the second group.
Isolates: there are also often several isolate nodes, which are nodes with no connections whatsoever. Above, I can see five isolate nodes. They were only connected to Valjean. With Valjean removed from his own Ego Graph, these nodes became isolates.
But most importantly, we've identified that Valjean is connected to two separate groups. The differences between these groups could make for interesting analysis. Why are they not connected? What do they do differently? And why are none of the isolates connected to anything else? What makes the isolates so utterly unspecial or special that nothing is connected to them?
Let's keep moving. I am going to do the same for the next four important characters. We could do this for every single node in the network, and it would take a very long time to analyze, but a tremendous amount of learning could be done about the story of Les Miserables if network analysis was used along with content analysis to dig deeper. Thus, the marriage of Network Science, Social Network Analysis, and Natural Language Processing is special and important to me. Moving on.
For these next characters, put your thinking caps on. Look at the images and try to answer the questions I ask.
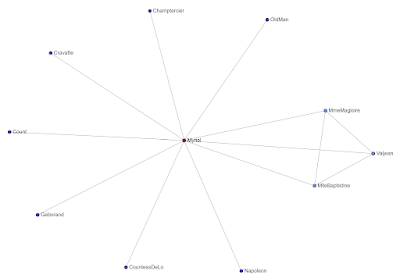
Myriel
Myriel's Ego Graph is almost a star network, but there are three characters on the right who are connected with each other. Myriel has a high PageRank score because of the number of edges, but Myrie's Ego Graph is very simple. If we drop the center node, what do you think will happen? How many isolate nodes do you think we will see? How many groups will we see?
As expected, dropping the center node shattered the network and left one small group and several isolate nodes. I can see seven isolate nodes and one small group. What is this small group that Myriel was a part of? What do they believe and do? Who are their members? How do they know each other?
Gavroche
Like Valjean, Gavroche has a very interesting Ego Graph. I can see the one center node. How many groups do you see? A group can be two people. If we drop the center node, how many groups do you think we'll be able to see? How many isolates?
This graph actually tricked me. I expected that there'd be three groups, but that is because I simply was not looking closely enough. In the earlier image, It looked like there were three groups: top left, bottom left, and bottom right. There are three groups. However, a few people in the bottom group had connections with the top group, so dropping Gavroche was not enough to split these two groups. They have some cohesion.
Did you guess the number of groups correctly? How about the number of isolates?
One of the groups was Child 1 and Child 2. What is their relationship with Gavroche?
What is the isolate's relationship with Gavroche?
Finally, what is this larger cluster of characters? Why are two groups linked together, with or without Gavroche? Who are these people? How would the absence of Gavroche in the story affect these characters?
Marius
Marius' Ego Graph has some interesting complexity as well. I can see at least one densely connected group of nodes on the top left, and I get the feeling that this is actually two separate groups of people but that there is some cohesion with the top left group. I expect that this network will not shatter if we drop the center node and that there will be no isolates. What is your bet? Try to draw a mental picture of what will happen after Marius is dropped.
As I expected, the group remained intact, even with Marius removed. Valjean is an important node in this network, and he has helped keep it together, along with others.
Who are these people? How do they know each other? Why is this network so resilient? If these characters are important, what would it take to eliminate their ability to work together? On the other hand, what would bolster the network?
Javert
Javert's Ego Graph is the last we will do today, but we could go much further. Feel free to learn from my code and investigate every node in the network. It's a great way to explore and learn!
What do you see? I see to central nodes: Javert and Valjean. I see one group of nodes on the left, and they are connected with both Javert and Valjean. I see some characters on the right who have connections to characters on the left. Because of all of this, if the center node is dropped, I suspect that this network will be resilient and not shatter. Because none of the nodes have fewer than two edges, I expect we will have zero isolates, because 2 - 1 = 1. Every remaining node will have at least one edge to another node. The network will remain intact. Essentially, this is a large group of connected individuals.
As I suspected, the network did not shatter. After dropping the center node, all remaining nodes are still connected with other nodes. The dense group is a little more discernable.
What is this group? Why are two very important characters so central in this network?
What are the Takeaways?
It is fun to explore any kind of social network, no matter the topic. You can learn a lot about any topic by exploring the social networks that exist inside that topic. In today's exercise, the topic is Les Miserables. We could have taken the raw text of this story, used the techniques from my book, and literally converted raw text into an explorable network. We can use the text of the book alongside the network to learn more about individual communities, and I will show how to do this at a later date. This is new material that is not included in the first edition of my book.
This exercise also showed that different shapes of networks are more resilient to attack. For instance, if you take a star network (the second character) and drop the center node, the network shatters into pieces. If you take a more densely connected network and drop even the most important node, the network can still remain intact. What are the implications of that for cybersecurity, for leadership, for national security, for teamwork, or for your own life? What fragile networks exist in your own life? What resilient networks exist in your own life?
For instance, in my own life, I am part of the LinkedIn Data Science community, and regularly post content and participate in conversations. That is a densely connected network, and that network would not be affected by my absence, or any one person's absence. It would just continue to grow and evolve. That's a resilient network that exists in my life. How about a fragile network? I have very few friends I hang out with in person. In a small group, if one person is removed, the effect is devastating on the group.
Let's Zoom Out a Little
I hope you have learned a bit from these discussions. We've already covered enough material for you to jump into network analysis. We haven't talked at all about network construction, but we've found a network to use and learn from. I promise, very soon, we are going to construct our own Graphs, not use something pre-made. I enjoy using networks to explore reality, not just use someone else's networks for learning.
We've learned how to construct a graph, render visualizations, identify important nodes, and zoom in on important nodes. These are fundamentals that you need, and you have them now, and we're only on day four. Getting the fundamentals out of the way in the beginning will leave us with a lot more time to explore.
What are you waiting for?
If you find this content interesting, please jump in and give this a try! Install Jupyter or use Google Colab and start exploring. You don't need to know everything on day one. Just get started. Learning to work with networks and explore relationships is powerful, and this skill becomes tremendously useful the deeper you go.
That's Enough for Today
I hope you found this to be an enjoyable read, and I hope my explanations made sense. This blog post was written quickly. If you would like to learn more about networks and network analysis, please buy a copy of my book!